An original policy framework

A score. A diagnosis. A path to the right intervention.

New York City has no single measure of how fairly it supports physical activity across neighborhoods. The MOI is a composite score that pulls fragmented public health, recreation and equity data into one transparent number per neighborhood.

Developed by Maillard Howell · New York City · 2026

4scoring dimensions
3intervention tiers
12action classes
0 to 100neighborhood score

The tools

Three free tools. One question each.

All three run on the same Phase 1 data for 10 priority neighborhoods. Free and public, no login required.

Tool 1 · Where is the need?

Neighborhood Dashboard

A view of the 10 Phase 1 neighborhoods, each scored and tiered across 4 dimensions. Open any neighborhood card for its full breakdown, data sources, constraint type and recommended intervention.
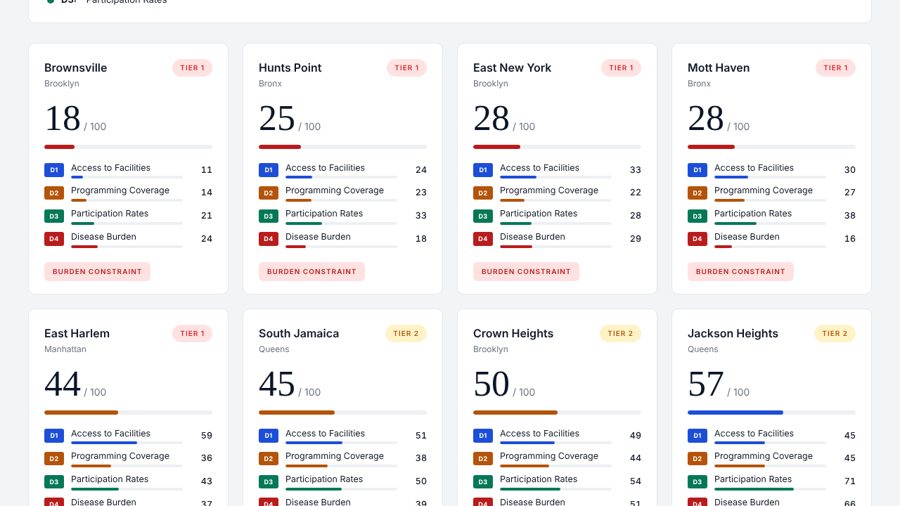
ShowsMOI score, intervention tier and dimension breakdown for each neighborhood
Built forCity leadership, elected officials, community advocates and public health researchers
Used forPrioritizing investment by need, and public accountability reporting
Open the Dashboard ↗
Neighborhood Dashboard score cards
Tool 2 · What kind of fix?

Action Matrix

A two-axis decision tool. Rows are intervention tiers set by the MOI score. Columns are the constraint driving the low score: supply, delivery, coverage or disease burden. Every neighborhood lands in one of 12 cells, and each cell is an action class with a timeline.
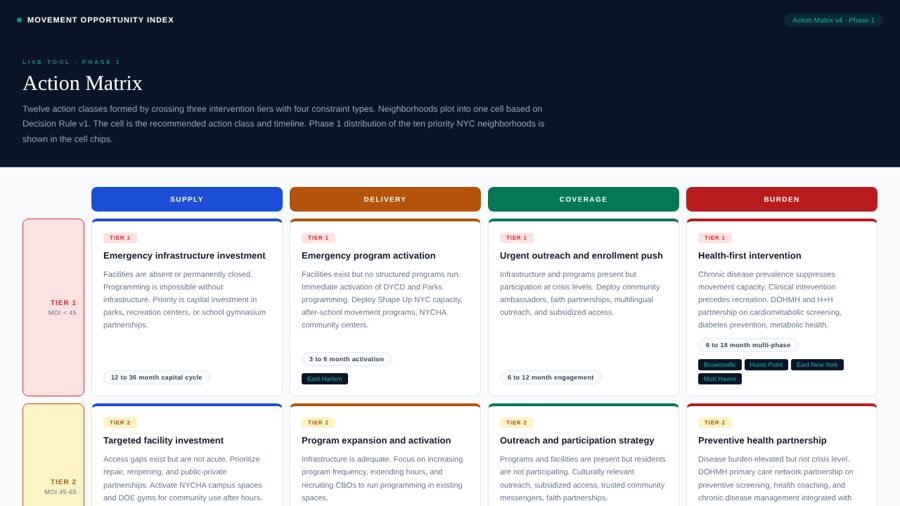
ShowsUrgency tier crossed with primary constraint, for every neighborhood at once
Built forAgency commissioners, budget directors and cross-agency planning teams
Used forMatching the right type of intervention to the right neighborhood
Open the Action Matrix ↗
Action Matrix grid of tiers and constraint types
Tool 3 · What should we do?

Action Decision Tree

The live diagnostic engine. Enter a neighborhood's 4 dimension scores, or pick a modeled neighborhood. It derives the tier, names the primary constraint, explains the role of each score and recommends an action class with a timeline. Every step of the logic is visible.
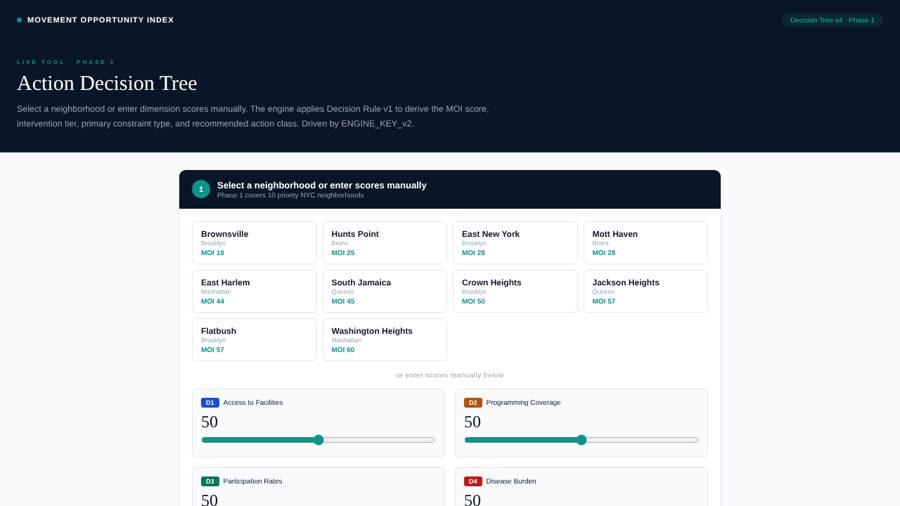
ShowsA step-by-step diagnosis from dimension scores to a recommended intervention
Built forProgram managers, community planners, borough coordinators and researchers
Used forNeighborhood-level decisions grounded in transparent, auditable logic
Open the Decision Tree ↗
Action Decision Tree input screen

How the score works

Four dimensions. One score. Fully auditable.

NYC's parks, recreation centers, school gyms, NYCHA campuses and senior centers sit across at least 7 agencies, with no shared standards. The MOI puts them on one scale, then turns each score into a decision.

Inputs
D1Access to facilities
D2Programming coverage
D3Participation
D4Disease burden
Each scored 0 to 100. Higher means better conditions.
→
Two readings
MOI score

Equal-weight average of the 4 dimensions, 0 to 100.

Tier 1 · under 45Tier 2 · 45 to 65Tier 3 · over 65
Answers: how urgent?
Primary constraint

Disease burden if D4 is 30 or below. Otherwise, the lowest of D1 to D3.

Supply · D1Delivery · D2Coverage · D3Burden · D4
Answers: what kind of fix?
→
Output
1 of 12 action classes

Tier × constraint sets the action and its timeline.

SupplyDeliveryCoverageBurden
T114incl. Brownsville
T214
T3
Where the 10 Phase 1 neighborhoods land.

What each dimension measures

DimensionWhat it measuresIf it's the constraintSources
D1 Access to facilitiesParkland acres per 1,000 residents; open recreation centers within half a mile; schoolyards open to the communitySupply: build or reopen facilitiesNYC Parks Open Data · NY4P Open Space Index · NYC Parks Capital Tracker · DOE Schools
D2 Programming coverageFree program hours per 1,000 residents per week; active DYCD after-school physical activity programs; senior center physical activity hours per weekDelivery: expand programs in existing spacesNYC Parks Recreation Programs · DYCD After School · DFTA
D3 ParticipationAdults meeting weekly physical activity guidelines; youth enrollment in after-school physical activity programs; senior enrollment in DFTA wellness programsCoverage: raise enrollment and reachDOHMH Community Health Survey · DYCD · DFTA
D4 Disease burdenDiabetes, obesity and hypertension rates. A lower score means a heavier burdenBurden: health-first interventionDOHMH Community Health Profiles 2021 · Community Health Survey · EpiQuery

Phase 2 keeps these 4 dimensions, rebuilds them with finer census tract data, and expands to all 59 community districts.

How the MOI compares

No tool I found covers all 4 dimensions and names the fix.

Cities and researchers have built strong tools for park access, health need and fitness rankings. I found no tool that scores facilities, programs, participation and chronic disease together for each neighborhood, then names the type of fix.

ToolFacilitiesProgramsParticipationChronic diseaseNeighborhood levelNames the type of fix
Atlanta Parks & Recreation Equity Data ToolAtlanta DPR with Bloomberg Associates, 2021YesPartlySurveyPartlyYesNo
Place Need ClassificationSport EnglandNoNoYesYesYesNo
American Fitness IndexAmerican College of Sports MedicineYesNoYesYesCity onlyNo
ParkScore and ParkServeTrust for Public LandParksNoNoFor priority areasParkServeNo
Open Space IndexNew Yorkers for ParksOpen spaceNoNoNoYesReport recs
Park visitation dataPlacer.ai (commercial)NoNoYesNoYesNo
Movement Opportunity IndexYesYesYesYesYesYes 12 classes
What's differentEvery tool above helps answer where need is highest. The MOI also answers what kind of fix comes first: facilities, programs, enrollment or health care. It also scores programs and participation separately from parks.
Where others are aheadThese tools are validated, backed by institutions, and cover whole cities or countries. The MOI covers 10 NYC neighborhoods with Phase 1 estimates.

Based on a public web scan of published methods, November 2026. Sources: Placer.ai · Atlanta DPR Equity Data Tool (Journal of Healthy Eating and Active Living, 2021) · Sport England Place Need Classification · ACSM American Fitness Index 2025 · Trust for Public Land ParkScore and ParkServe · New Yorkers for Parks Open Space Index.

About this data

A working framework in Phase 1.

What "research-informed estimates" means

The neighborhood scores in the tools come from real published data points. For example, Brownsville's access score of 11 draws on DOHMH, New Yorkers for Parks, the NYC Parks Capital Tracker and peer-reviewed public health research. The scores demonstrate how the framework works. They are not yet outputs of a validated agency data pipeline.

Confirmed data points include:

  • Central Harlem parkland at 0.3 acres per 1,000 residentsNew Yorkers for Parks Open Space Index
  • Hansborough Recreation Center closed for reconstruction; Brownsville Recreation Center funded for a full $160 million rebuildNYC Parks Capital Tracker · NYC Mayor's Office 2024
  • East Harlem adult diabetes at 20%DOHMH Community Health Profiles 2021
  • Mott Haven and Melrose adult obesity at 42%DOHMH Community Health Profiles 2018

Producing validated MOI scores requires a formal data standardization process, led with a data scientist or biostatistician experienced in public health composite indexes.

Roadmap

From framework to live city tool.

Phase 1 · Now

Framework design

Dimension definitions, scoring logic, tier system, constraint types, intervention mapping and working prototype tools.

Phase 2 · Next

Data validation

Finer census tract data from national and city sources, rolled up to neighborhoods. Validated scores for all 59 community districts.

Phase 3 · Vision

Live deployment

A public dashboard updated quarterly and built into cross-agency planning. The logic is designed to be adapted for other cities; only the data pipeline changes.

For researchers and data scientists

Want the full technical methodology?

The full scoring rule, all 12 indicators and their sources, two worked examples, and how to request the technical files.

Read the methodology →

Get involved

This framework is open for collaboration.

The MOI needs data partners, policy champions and city governments willing to pilot it. If you work in public health, urban planning, recreation policy or community wellness, I'd like to hear from you.

Get in touch